- Powerful Chrome Apps (NCS EdTech News 30 October 2013)
- Chrome is the New Black (NCS EdTech News, 7 April 2014)
- Chrome Apps, Tools, and Extensions
Tuesday, September 30, 2014
Going Google (Part 6): Chrome
Chrome is just a browser, but there are tons of interesting apps and tools for Chrome in terms of teaching and learning. Here are a few compilations:
Going Google (Part 5): My Maps!
Google My Maps is a nice and simple way to create and share maps online. There are fancier apps such as Tour Builder or Esri Story Maps, but Google My Maps is about as easy as online map making can be: 1) add markers, 2) connect photos and videos, and 3) share!
Here's a quick tutorial and a simple example.

Here's a quick tutorial and a simple example.
Friday, September 26, 2014
Going Google (Part 4): Google Classroom
Looking for an alternative to PLATO? Perhaps something lightweight without the bloated features of Blackboard, yet with some education-specific features? Google's Apps for Education have been around for a while and now we get Google Classroom. The initial reviews have been somewhat mixed, but why not try it yourself?
- Google Classroom: First Impressions (Profhacker)
- Google's Classroom tool open to teachers worldwide (CNET)
- Introduction to Google Classroom (Edudemic)
- Is Google's Free Software A Good Deal For Educators? (NPR)
 |
| http://www.npr.org/blogs/ed/2014/08/26/341943780/is-googles-free-software-a-good-deal-for-educators |
Going Google (Part 3): ePortfolios
Online or ePortfolios are getting more and more popular in Higher Education as assessments tools (see, for example, Chang et al., 2014). But, how do you implement this? LiveText is our 'official' portfolio system, but that forces students into an expensive commercial (and proprietary) system.
There are many options for creating a free and public web presence (Wordpress, Weebly, Google Sites, etc.) and share whatever you want with the rest of the world, including academic materials. I personally like the combination of Google Blogger and Google Drive: students use Google Blogger as their ePortfolio and link to files, content, and media stored on their Google Drive.
Here's a simple tutorial I created for our students - feel free to use and edit it as you like.
Tuesday, September 23, 2014
Going Google (Part 2): Chromecast
I never thought of that one: simply plugin the Chromecast dongle into your classroom TV and you can show YouTube videos and mirror the screen of your laptop or other portable device. No, this is isn't perfect, but I can't imagine a cheaper solution to connect your classroom TV to the Internet. Does anyone here have TV in their classroom so we can try this? Here are some ideas of what we could do:
- Streaming Video Magic with Chromecast (Profhacker)
- Teachers: Use ChromeCast for Wireless Presentations on Desktop and Mobile (Ted Curran)
- Review: Chromecast – Will it Work in Your Classroom?
- Possibilities for Chromecast in the Classroom
- How Chromecast can be used in the classroom and how to test it without the actual device
 |
| http://www.classthink.com/2013/10/18/chromecast-review-will-chromecast-work-classroom/ |
Going Google (Part 1): Chromebooks
Here is an interesting post by Jason Jones at ProfHacker: Eight Thoughts After Trying the Samsung Chromebook.
Chromebooks are cheap ($249) netbooks running Google's ChromeOS to give you access to the Google 'ecosystem' of tools - nothing more, nothing less. That's not too different from the approach Apple took with iOS and its associated devices: here's the hardware, the OS, and the apps and we will make it impossible for you use anything else.
Full disclaimer: I have not touched or used a Chromebook, but it seems a rather limited option - for a couple of hundred dollars more you can get an inexpensive real computer. Still, Chromebooks may be an option when you want to restrict choices, but still want a computer with a real keyboard or mouse (as opposed to a tablet).
In that sense Chromebooks may be the 'happy medium' between providing each student with a high-end laptop or forcing every student to bring their own computer to class (aka a BYOD policy). Chromebooks seems to be getting more popular and accounted for 21 percent of notebook sales in the US.
Friday, September 19, 2014
Apps for Outdoor Labs and Fieldwork
There are about 1 millions apps each for iOS and Android, plus another 200,000 more for Windows, so any attempt to survey all apps suitable for outdoor labs, fieldwork, or citizen science is futile. Instead, here are several compilations by other folks.
- Mobile Geoscience by Frank Granshaw at Portland Community College.
- Smartphone Apps for Field Biologist is a list maintained by the Bruna Lab for Tropical Ecology at the University of Florida.
- Wallace and Witus (2013, Table 1)
Here are some apps I recently came across:
- GeoSciTeach is customizable app for science fieldwork described by Price et al. (2014). Read more about it on their project website.
- Fulcrum is great (albeit not cheap) and OpenDataKit is the open-source equivalent.
- Snap2Map works with ArcGIS Online to create Story Maps.
- SeeClickFix is more of a citizen mapping tool.
- EpiCollect is a GPS-tagged data collection app and web-based data sharing platform. iNaturalist and Spotter and NIEmGEO are similar to EpiCollect.
- FieldScope is an online mapping and data collection tool by the National Geographic Society and Fieldtrip GB is great for data collection on field trips and citizen science projects.
- Moose Survey or The Great Koala Count or Merlin Bird ID by eBird or Magpie Mapper or Project BudBurst or the Coastal Walkabout.
- Autodesk 123D Catch generates 3D models from 'regular' images and EarthViewer let's you explore Earth's history and GeoFieldBook is a field book app for iOS.
- Appernathy is a field data collection app for salamander observations.
Not finding what you are looking for? How about creating your own Android app with the MIT App Inventor, but make sure you consider the advice by Teacher et al. (2013). Or, build your own field data collection app using GeoSciTeach or ask me for support.
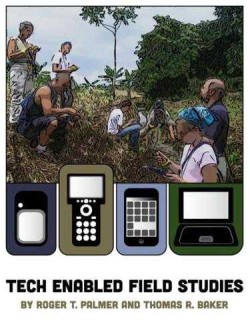
Tech-Enabled Field Studies (Book Review)
Tech-Enabled Field Studies by R.T. Palmer and T.R. Baker
Available @ http://gisetc.com/product/gps_field_studies/ for $14.99 as PDF or $29.99 as hard copy.
The book contains 10 chapters in three logical sections. Section I (Getting Started) begins with the pedagogy of field studies as inquiry-based teaching and learning and nicely expands the idea of fieldwork to other disciplines that we may not immediately associate with fieldwork such as history, mathematics, or art. Section II (Tools) includes 7 chapters explaining the tools of 21st century field studies. The emphasis here is on hardware and software for location-based field data collection by students (see Page 53 for a simple example).
This is a very useful book (and a quick read) for anyone interested in adding more location-based ‘tech’ into their outdoor labs, field trips, or student field data collection campaigns. Smartphones are rapidly becoming ubiquitous among students and teachers so why not! In a recent survey, over 90 percent of Westfield State students reported owning an internet-enabled smartphone, a percentage that matches national surveys. The book is a bit GIS-and Esri-heavy at times, for example Chapters 7, 9, and 10 are only useful if you are comfortable using ArcGIS Desktop and you teach at an institution with an ArcGIS Online for Organization account (Westfield State does!). The price is right, so why not get a copy for yourself and/or your department library?
Read the brief summary and review from the Esri Ed Team, watch the great 3-part video series 7 Ways to Map Your Field Data by Joe Kerski, and explore the GPS and fieldwork resources compiled by Esri.
Available @ http://gisetc.com/product/gps_field_studies/ for $14.99 as PDF or $29.99 as hard copy.
The book contains 10 chapters in three logical sections. Section I (Getting Started) begins with the pedagogy of field studies as inquiry-based teaching and learning and nicely expands the idea of fieldwork to other disciplines that we may not immediately associate with fieldwork such as history, mathematics, or art. Section II (Tools) includes 7 chapters explaining the tools of 21st century field studies. The emphasis here is on hardware and software for location-based field data collection by students (see Page 53 for a simple example).
- Chapter 5 introduces the EdGIS Student Data Mapper, an easy and (almost) foolproof way to get data from the student’s smartphones into spreadsheets, Google Earth, or web-mapping services such as ArcGIS Online.
- Chapter 6 introduces the EdGIS GeoForms tool, an effective way to turn Google Forms into location-enabled data collection and mapping forms for smartphones or tablets.
This is a very useful book (and a quick read) for anyone interested in adding more location-based ‘tech’ into their outdoor labs, field trips, or student field data collection campaigns. Smartphones are rapidly becoming ubiquitous among students and teachers so why not! In a recent survey, over 90 percent of Westfield State students reported owning an internet-enabled smartphone, a percentage that matches national surveys. The book is a bit GIS-and Esri-heavy at times, for example Chapters 7, 9, and 10 are only useful if you are comfortable using ArcGIS Desktop and you teach at an institution with an ArcGIS Online for Organization account (Westfield State does!). The price is right, so why not get a copy for yourself and/or your department library?
Tuesday, September 16, 2014
Tablets for Outdoor Labs and Fieldwork
Tablets and smartphones are great when we go outside - this may be most obvious in the natural sciences and regional planning, but includes 'field' experiences or citizen geography in any discipline including, for example, civic engagement projects or study-abroad trips.
These 'smart gizmos' provide internet connectivity, GPS, digital camera, sound recording, accelerometers, external sensors, and data entry/storage capabilities and in the future may add some pre-processing for the collected data such as image and sound analysis. Further down the road we might be wearing Google Glass and Augmented Reality in our field work or outdoor labs! Here are several recent paper and case studies:
But - are we using technology just for technology’s sake? In other words: are tablets really adding additional learning dimensions (apparently they do!) or are we following the Borg Complex? Or: does the ‘coolness factor’ of tablets alone add enough motivation (apparently so: see here and here and here) to justify the expenses? Wallace and Witus (2013), for example, argued that using iPads in the field and classroom increased their students overall confidence in their ability to use technology effectively.
To me there are three key issues for success. First, the institution has to provide the tablets with all needed apps and accessories (cases. stylus, etc.). Second, the institution has to provide adequate training for faculty and students so that time is not wasted figuring-out how the smart gizmos work. Finally, from a practical standpoint, the tablets have to be equipped with cellphone-based internet connectivity (3G, 4G, etc.) so students can immediately share their data and photographs.
How about this for a low-tech/high-tech alternative: Field Papers! or Virtual Fieldwork!
These 'smart gizmos' provide internet connectivity, GPS, digital camera, sound recording, accelerometers, external sensors, and data entry/storage capabilities and in the future may add some pre-processing for the collected data such as image and sound analysis. Further down the road we might be wearing Google Glass and Augmented Reality in our field work or outdoor labs! Here are several recent paper and case studies:
- J. Treworgy, 2013: Using iPads to Enhance Learning and Teaching on Field Trips in Introductory Geology Courses. In the Trenches, 3(4), October 2013. This paper is a case-study of using iPads as modern-day clipboards - students used WhiteNote to annotate their pictures and SyncSpace as their shared whiteboard.
- D. Wallace and A.E. Witus, 2013: Integrating iPad Technology in Earth Science K-12 Outreach Courses: Field and Classroom Applications. Journal of Geoscience Education, 61(4), 385-395.
- Z.I. Johnson and D.W. Johnston, 2013: Smartphones: Powerful Tools for Geoscience Education. EOS, 94(47), 433-434.
- A. Teacher and 3 others, 2013: Smartphones in ecology and evolution: a guide for the app-rehensive. Ecology and Evolution, 3(16), 5268-5278. This paper includes many examples of existing apps and illustrates the app development process with two case studies.
- F. Granshaw, 2013: Tablets in the Field: Tools for Student-Created Virtual Field Environments. In the Trenches, 3(4), October 2013.
- M.H. Schneps and 5 others, 2014: Conceptualizing astronomical scale: Virtual simulations on handheld computers reverse misconceptions. Computers & Education, 70, 269-280.
- S. Whitmeyer and D. De Poar, 2014: Crowdsourcing Digital Maps Using Citizen Geologists. EOS, 95(44), 397-399.
- S.B. Fee and C. Griffith, 2013: Custom Mobile Application for Collection of Field Data. CUR Quarterly, 34(2), 22-26.
But - are we using technology just for technology’s sake? In other words: are tablets really adding additional learning dimensions (apparently they do!) or are we following the Borg Complex? Or: does the ‘coolness factor’ of tablets alone add enough motivation (apparently so: see here and here and here) to justify the expenses? Wallace and Witus (2013), for example, argued that using iPads in the field and classroom increased their students overall confidence in their ability to use technology effectively.
To me there are three key issues for success. First, the institution has to provide the tablets with all needed apps and accessories (cases. stylus, etc.). Second, the institution has to provide adequate training for faculty and students so that time is not wasted figuring-out how the smart gizmos work. Finally, from a practical standpoint, the tablets have to be equipped with cellphone-based internet connectivity (3G, 4G, etc.) so students can immediately share their data and photographs.
How about this for a low-tech/high-tech alternative: Field Papers! or Virtual Fieldwork!
Friday, September 12, 2014
Why am I using Clickers this semester? (Part 1)
Guest post by Dr. Jennifer Hanselman (Biology)
First year students, 8:15 am, introductory biology, 63 students, teaching in an auditorium…we all assess our audience and our classroom and then decide the best methods for communicating our content each and every lecture. Early on in the semester, we are planning and preparing our syllabi, our lectures, and our lab activities. Beyond the handouts and content, we also contemplate ways to engage our students effectively in the classroom.
This semester, my introductory biology lecture class size has doubled and is now being taught in an auditorium. Even though my lectures have ample opportunities for discussion, the percentage of students that actively participate is inversely correlated to class size, so I hope the use of Clickers will add value to the lectures each week.
I have used Clickers in the past to check for student understanding and to get the immediate feedback necessary to adapt to my student audience. In a class of 32, Clickers were an added bonus, a simple way to check attendance and encourage class participation. Now with a lecture size of 63, Clickers have an increased value. I hope the use of Clickers helps engage the students in an environment that yields greater distractions.
Integrating Clickers is fairly easy – just link up the Clickers to the receiver and run the program…however, if I want to collect individual student data, I need to link a Clicker to each student. As I wait for Add/Drop to end and my roster to finalize, I will link each individual Clicker to a student. Because the six digit serial number would be difficult for a student to identify (and I do not want them to take the Clickers with them), I placed labels on each Clicker for easy pick up when the students walk in to class.
I tell the students that the Clickers help maintain the muscle memory they need for texting…and hopefully it adds a bit more value to a class as well!
 |
| http://56wrtg1150.wikidot.com/clickers |
Story Maps and Tour Builder
What are story maps? Fun ways to organize and present information in a geographic context! I think storytelling with maps can be an effective way to facilitate, scaffold, and assess student learning while using 21st-century technology. Here are a few examples:
Best of all you can create these maps without any special technology right now from your desk or classroom, but it is more fun with a smartphone and some fieldwork with students (using, for example, the Snap2Map app). Here's all you need to know!
Alternatives to Esri and Google are explained in these Seven Ways to Create a Storymap. Or, just try Visits or Heganoo or StoryMap JS.

- The Mount Cardigan Story Map. This map tells a simple story: hiking Mount Cardigan, but with embedded photos, videos, web links, audio, and panoramas.
- Costa Rica (2014). This is a similar type of story, but this time using Tour Builder.
- Along 40 Degrees North. Travel across the US and experience how and why the landscape changes.
- Light Rail in Denver. Travel along the new West Rail Line.
Best of all you can create these maps without any special technology right now from your desk or classroom, but it is more fun with a smartphone and some fieldwork with students (using, for example, the Snap2Map app). Here's all you need to know!
Alternatives to Esri and Google are explained in these Seven Ways to Create a Storymap. Or, just try Visits or Heganoo or StoryMap JS.
Tuesday, September 9, 2014
Interactive Projectors and WeTables
Interactive projectors are simple: just combine a regular computer projector with an infrared controller (think Kinect or Wii) and you can create an interactive touchscreen or smart board on any wall.
Or, take an ultra short-throw interactive projector and turn any table into huge touch screen.
Or, mount the projector on a stand to create an interactive touch floor!
You also stick a regular projector on a tripod, connect a Wii controller, and built your own interactive projector - just google WeTable for examples, including the Delaware Sea Grant College Program.
Collaboration anyone? Let me know if you want to try one!
Liquid Galaxy
Guest post by Laura Wilson (Systems and Digital Services Librarian)
Imagine taking your students on a tour of the White House, Musée d’Orsay, or the Grand Canyon without ever leaving campus. This is now possible thanks to Ely Library’s installation of Liquid Galaxy. Liquid Galaxy is a panoramic screen connected to Google Earth that allows users to virtually tour the world. The panoramic screen gives each virtual tour an immersive 3D experience. The educational uses for Google Earth and Liquid Galaxy are nearly endless.
Here are a few links with ideas:
- Teaching with Google Earth (SERC)
- Teaching (and Learning) with Google Earth
- Google Lit Trips
- Google Maps Education
- Google Earth Cool Places
- Liquid Galaxy Live Demo at TED
- Explore the Everglades with Liquid Galaxy
Friday, September 5, 2014
Infographics and Data Viz
Infographics are quite the thing these days = appealing visualizations of information (= data viz) to tell a story. Infographics can (and do) include 'traditional' data charts, but commonly use icons, graphical elements, and non-traditional charts for displaying quantitative data. Here are some sources about infographics and how to use them for teaching and learning:
- Kathy Schrock's Infographics as a Creative Assessment
- New York Times Teaching With Infographics
- visual.ly How to Turn Infographics Into Effective Teaching Tools
- Stephanie Richter (Northern Illinois U.) Teaching with Infographics
- Bad Infographics and How to Check for Accuracy
Tuesday, September 2, 2014
Banning Laptops or Lectures?
This opinion piece in the New Yorker caused quite a stir over the summer: The Case for Banning Laptops in the Classroom by Dan Rockmore (a professor of mathematics and computer science at Dartmouth College). His arguments are not anything new: computers in the classroom are distracting and note-taking by typing turns students into "transcription zombies". Ragan et al. (2014), for example, found that students were off-task over 60 percent of the time in a large lecture-based university class.
Robert Talbert (and others) responded with Three issues with the case for banning laptops and argued instead that laptops (or technology in general) are not the underlying problem or distraction, but rather that the outdated pedagogy (= lectures) is distracting from learning. Furthermore, the whole notion of banning technology in the classroom may become moot with the proliferation of wearable technology over the next few years!
About 33 percent of our students reported NOT bringing their laptops to class because they are a distraction for them (and about 21 percent because their professor maintained a no-laptop policy in-class). You can find-out more about how our students use their laptops in Questions 12 to 16 of our Fall 2013 Student Technology Survey.
 |
| http://doonesbury.washingtonpost.com/ |
Annotate Videos!
Okay, annotating content created by other people is nothing new and we do it all the time, for example:
- We use track changes in MS Word or Google Docs for document edits or revisions.
- There are dozens of apps for annotating photos on tablets, for example Skitch.
- We can annotate PDFs on our tablets using iAnnotate or PDF Expert as grading tools.
- We can even annotate PDFs and other online course materials collaboratively using MITs Nota Bene.
But, I always wanted a way to annotate YouTube videos, for example to add questions, provide context, or offer additional explanations. Well, try Vidbolt or VideoANT! ProfHacker has a review of Vidbolt and Jonathan Senchyne explains how he uses Vidbolt in teaching.
 |
| http://blog.lib.umn.edu/tel/blog/2012/03/video-ant-a-video-annotation-t.html |
Screencasting
Here is a simple approach that does not require Jing, Camtasia, or any other additional software:
- Create your lecture or presentation in MS PowerPoint.
- Click on Insert - Audio - Record Audio...and record your audio clip. Move the sound icon into a consistent but unobtrusive corner of the slide.
- Repeat for all slides as needed.
- Save and share the PPT file directly - but that can create issues with software compatibility, especially between different operating systems.
- Better: save as an MP4 file or Windows Media Video file and share - each slide will 'show' as long as your narration lasts and then advance to the next slide.
- Even better: upload your MP4 file to YouTube and share as link or embed into your blog or website.
Or: use Snagit for Google Chrome (video).
Here are Simple Screencasting Tips from Profhacker and Clone Yourself Through Screencasts! from NCS EdTech News.
Here are Simple Screencasting Tips from Profhacker and Clone Yourself Through Screencasts! from NCS EdTech News.
 |
| http://law.niu.edu/taconnections/2010/spring/screencasts.shtml |
Student Survey (Fall 2013)
The results of our Fall 2013 Student Technology Survey are now compiled, accessible, and analyzed. Scroll-down to Page for the Summary and Highlights or explore The Summary Infographic (also available as a PDF). Section 3.9 (Page 19) lists the Top-10 concerns identified by our students in final open-ended survey question.
Subscribe to:
Posts (Atom)